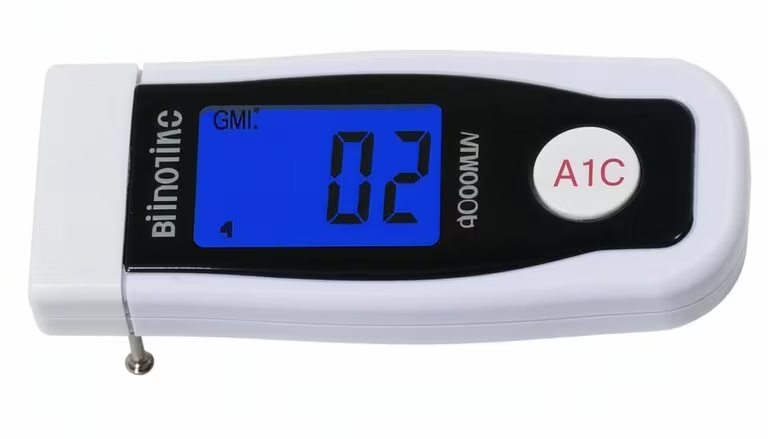
Calculating A1C Made Easy: Your Personal A1C Calculator Guide
Easily calculate your A1C and learn the importance, methods, and accuracy of using an A1C calculator guide. We have a plethora of insightful information to assist you with your diabetes management, including using our accurate A1C calculator tool!
What is A1C?
Let’s chat about something super important for folks handling diabetes—A1C levels. Now, maybe you’re thinking, “What in the world is A1C?” Well, it’s a nifty little test for keeping an eye on average blood sugar over the past few months. Yep, it’s like a report card for your glucose habits!
Conducted by a healthcare pro, this test measures the percentage of sugar-laden hemoglobin in your red blood cells over the last 2-3 months. So, hemoglobin is the protein trucking oxygen through your bloodstream, right? When sugar makes friends with hemoglobin, they form glycated hemoglobin, also known as A1C. More glucose hanging out equals higher A1C levels. You can find more details on this from places like the American Diabetes Association.
A1C is shown as a percentage. If you’re clocking in at 7%, that means 7% of your hemoglobin is on a sugar high—sort of.
Why Measure A1C
Why bother with A1C levels, you ask? Because it’s like having a GPS for diabetes management. Regular checks give you the lay of the land when it comes to your blood sugar. Let’s break down some perks of measuring your A1C:
- Peek at Blood Sugar Trends: The test dishes out your average sugar levels over some months. It’s pretty handy for you and your doc to see if your treatment is on the money.
- Tuning Your Treatment: Based on your A1C, your healthcare team can tweak meds, diet, or lifestyle straight away for better control over those sugar numbers.
- Spotting Health Threats: High A1C is like a warning bell for other problems like heart issues or nerve damage. Keeping it in check can cut down those risks.
Your Personal A1C Calculator Guide
To go deeper into A1C terms (A1C calculator guide), check our a1c levels chart and the a1c reference range tailored for your health goals. And hey, keeping track helps you crush your personal diabetes management game, maybe even lower A1C naturally.
| A1C Level | Average Blood Sugar (mg/dL) |
|---|---|
| 5% | 97 |
| 6% | 126 |
| 7% | 154 |
| 8% | 183 |
| 9% | 212 |
| 10% | 240 |
Armed with the right tools and know-how, you’re set to be the boss of your diabetes and keep those A1C levels ship-shape. So remember, understanding what A1C is all about and getting tested is a big win for managing your everyday health.
Interpreting A1C Results
Getting your head around A1C results ain’t rocket science, but it is key in keeping tabs on diabetes. Trust me, I got you covered as we take a chill dive into the A1C levels and how they relate to your health.
Normal A1C Levels
So, the CDC says if you’re hitting below 5.7% on the A1C test, you’re in the clear – pretty much means your blood sugar’s been behaving for the last three months. Score! Keep it under wraps here, and you’re dodging diabetes and a whole mess of its buddies.
| A1C Level | Interpretation |
|---|---|
| < 5.7% | Normal |
Got an itch for more detail? Check out our insights on normal A1C values.
Prediabetes and Diabetes Thresholds
Things start getting sketchy when the A1C numbers creep up past the normal but ain’t full-on diabetes yet. Welcome to the prediabetes zone, where levels between 5.7% and 6.4% are sounding the alarm. It’s like a wake-up call to shake up the lifestyle before things get serious (Agamatrix).
| A1C Level | Interpretation |
|---|---|
| 5.7% – 6.4% | Prediabetes |
Hit 6.5% or more, and we’re at diabetes station. Time to have a heart-to-heart with a health professional and get the full scoop if you’re rocking 5.7% or higher (GoodRx).
| A1C Level | Interpretation |
|---|---|
| ≥ 6.5% | Diabetes |
Need a snapshot? Our A1C levels chart lays out the details.
Understanding your A1C isn’t just doctor talk—it’s your ticket to managing blood sugar, grabbing life by the horns, and living healthier. The A1C test gives you the lowdown on your average blood sugar over the past few months. It’s like your diabetes report card, no homework required! (Veri).
Curious about naturally dialing down A1C? Hit up our guide on reducing A1C naturally for tips on staying in the groove. Plus, our A1C reference range has got all the nitty-gritty you need.
Importance of A1C Testing
Keeping tabs on diabetes isn’t a walk in the park—it’s more of a marathon than a sprint. One of the trusty tools in this steady race is the A1C test. This little number cruncher offers a sneak peek into your past blood sugar levels over two to three months, painting a picture of how well you’re managing your glucose levels.
Monitoring Blood Sugar Control
Understanding my blood sugar can sometimes feel like nailing Jello to a wall. That’s where the A1C test comes waltzing in. When I whip out that A1C calculator, it spits out an average that shows how I’ve been doing overall in managing this diabetes gig. It’s about as important as that first cup of coffee in the morning.
| A1C (%) | Estimated Average Glucose (EAG) (mg/dL) |
|---|---|
| 5.0 | 97 |
| 6.0 | 126 |
| 7.0 | 154 |
| 8.0 | 183 |
| 9.0 | 212 |
Info courtesy of the American Diabetes Association
Checking up regularly on my A1C taps into the patterns, letting me see how meals, exercise, meds, and stress tag-team to influence my glucose levels. The day-to-day self-tests are those quick check-ins, but A1C? That’s the big picture map. It complements the short-term self-tests (Accu-Chek).
I’m shooting to keep my A1C within my personal sweet spot (normal A1C values). With a bit of a game plan and sticking to my diabetes self-care routine like a good habit, I’ve noticed my A1C heading in a better direction in a couple of months ( calculating my A1C ).
Influence on Diabetes Management
Nailing down what those A1C numbers mean helps me steer my ship right. I read ‘em, make sense of ‘em, and tweak my treatment plan accordingly. Dropping that A1C number can really save my neck from long-term trouble like nerve, retina, kidney issues, and heart troubles (Accu-Chek).
An A1C check at least twice a year is my way of keeping tabs on my progress with my doc, flipping the script as needed. This teamwork keeps my blood sugar where it should be, dodging any unexpected revenges. If you’re not wrestling with diabetes, you can get away with checking less often—just focus on what’s up health-wise for you.
Watching my A1C is like taking the temperature of my diabetes management. It tells me if what I’m doing is working or if I need to switch gears. Naturally cutting down on A1C with some lifestyle tweaks has been a bit of a game-changer for me (reducing A1C naturally).
Having A1C markers is a solid arrow in my diabetes management quiver—it helps me dodge health problems and gives me peace knowing I’m on the right track with my personal goals. Using an A1C levels chart keeps me grounded in my health journey, ensuring I’m steering in the right direction.
A1C Calculation and Accuracy
So, you’re here to crack the A1C code with our A1C calculator guide and get savvy with diabetes management, right? Let me break it down for you: we’re diving into calculating A1C and understanding what might mess with those numbers.
A1C Calculation Methods
When it comes to keeping tabs on diabetes, knowing how the A1C is calculated is like the secret sauce. The A1C test tells us how sweet you’ve been over the past couple of months by measuring the sugar stuck on your hemoglobin (fancy word for part of your blood). This gets translated into something you might see on a regular blood sugar monitor—an estimated Average Glucose (eAG).
Here’s the quick and simple math to figure out your eAG from your A1C:
[ \text{eAG (mg/dL)} = (28.7 \times \text{A1C}) – 46.7 ]Let’s do a bit of math magic. If an A1C test shows 7%, punch that in:
[ \text{eAG} = (28.7 \times 7) – 46.7 = 154 \text{ mg/dL} ]And here’s a table to make your life easier:
| A1C (%) | eAG (mg/dL) |
|---|---|
| 6% | 126 |
| 6.5% | 140 |
| 7% | 154 |
| 7.5% | 169 |
| 8% | 183 |
With these numbers in mind, you get a clearer picture of your sugar control. The ADA reckons most people should aim for an A1C of around 7%, which corresponds to an eAG of 154 mg/dL. But hey, everyone’s different!
Got more questions about what’s considered normal? Check out our page on normal A1C values.
Limitations of A1C Testing
A1C testing is super useful, but it’s not perfect. Here’s why:
Blood Oddities: Stuff like anemia or kidney problems can throw A1C numbers off. Plus, some rare hemoglobin quirks can do the same trick, so it’s not always 100% spot-on.
Red Blood Cell Lifespan: A1C testing looks at sugar-coated hemoglobin. If something makes your blood cells have a shorter lifespan—like certain anemias—your A1C might be lower than your actual sugar levels.
Lab Differences: Sometimes, the human factor or the machines at different labs can lead to varied results. Using a standardized and certified lab can help ensure you’re getting the real deal.
If you’re on the prowl to drop your A1C naturally, check out our guide here for tips and tricks.
Understanding how A1C is calculated and what messes with it gives you an edge in managing your diabetes. Curious about difference ranges? Peep our A1C levels chart to get the full scoop.
For more insights on our A1C calculator guide, head over to the A1C reference range post and other helpful stuff we’ve got lined up.


